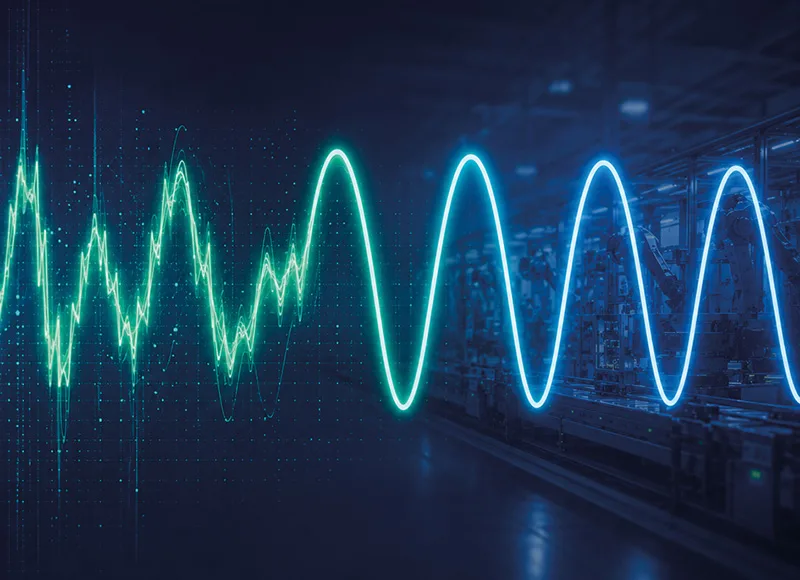



In power quality, critical events don’t always show up as an obvious “blackout”: they are often intermittent, multi-cause and tightly linked to what is happening in the process (start-ups, fast cycles, non-linear loads). This “elusive” nature is precisely why data is the first real asset: if you don’t measure, you can’t tell an isolated anomaly from a recurring pattern that is already eroding reliability and productivity.
The starting point is therefore structured evidence collection through an energy audit: measurements, data historisation and technical interpretation of electrical (and, where available, physical) parameters. Once the issues are identified – voltage variations, micro interruptions, instability, distortion, thermal stress – the next step is selecting and implementing the right technological solutions (stabilisation, compensation, filtering, power factor correction, optimisation).
At that point, however, the job isn’t “done”: predictive maintenance becomes the ideal tool to ensure equipment operates correctly and to prevent problems before they impact production. Trends, repeated anomalies, threshold exceedances, overheating and instability are not just alarms: they are weak signals which, if interpreted and correlated, enable targeted action.
In this context, cloud monitoring is a key resource: it enables historical data, alerting and scalable analysis, turning power quality into a truly data-driven discipline.
WHERE DATA ANALYSIS THROUGH AN ENERGY AUDIT CREATES THE MOST VALUE IN POWER QUALITY (SECTORS AND SCENARIOS)
HIGH-SENSITIVITY SECTORS
- Automated manufacturing (lines, robots, packaging): trips, resets and micro-stops are costly because they disrupt sequences and synchronisation.
- Process industry (chemicals, plastics, paper, cement): process continuity, variable loads and thermal stress make trend analysis particularly valuable.
- Food & beverage: line stoppages and electrical instability can translate into scrap and batch loss.
- Pharma/electronics: process quality and repeatability require stable parameters and anomaly control.
- Data centres/critical infrastructure: near-zero tolerance for events; even micro-interruptions and fast disturbances matter.
- Automated logistics: many drives, fast cycles and load peaks make it essential to detect repetition and correlations.
Ortea targets industrial environments, advanced tertiary facilities and infrastructures where continuity and equipment protection are operational priorities.
WHY POWER QUALITY IS DATA-DRIVEN AND WHY PREDICTIVE MAINTENANCE MATTERS
YOU DON’T PREDICT THE FUTURE: YOU RECOGNISE DEGRADATION PATTERNS
Predictive maintenance isn’t “magic”: it’s not about guessing when a failure will occur, but about recognising how a system is degrading. The practical difference is:
- Sudden failure: seems to happen without warning (often because the right variable wasn’t measured, or not at the right granularity).
- Failure that leaves traces: provides signals before the final event (slow drift, increasing variability, repeated micro-events).
In power quality, the “trace” may be a very short event (transient), a slow trend (drift in voltage/currents/power factor) or a correlation with specific process conditions (only on one line, only at a certain load).
FROM “MACHINE DOWNTIME” TO A “RISK SIGNAL” (WEAK SIGNALS TO LOOK FOR)
Weak signals are not definitive diagnoses: they indicate that the probability of a problem is rising. Catch them early and you reduce unplanned downtime and improve intervention quality.
Signals to monitor (with a “trend + context” mindset):
- Persistent abnormal temperature: often the first sign of stress, inadequate ventilation or components operating out of spec.
- Parameter drift (voltage, power factor, currents): it’s not the single value but the drift over time versus baseline and the speed of change.
- Repetition of transients/events: a small but frequent event is often more serious than a single isolated spike.
- Increase in minor alarms: often precedes major alarms – the system is “getting worse” step by step.
- Process-correlated anomaly: appears only when a specific line/machine/recipe runs à predictive becomes diagnosis.
- Wider oscillations: if a KPI “wobbles” more and more, you’re usually losing control (variable loads, degrading components, changing network conditions).
PREDICTIVE MAINTENANCE VS PREVENTIVE MAINTENANCE (PRACTICAL EXPLANATION)
- Preventive maintenance = calendar
Scheduled interventions regardless of actual condition. Useful, but may lead to premature replacements or “empty” checks.
- Predictive maintenance = real condition
Evidence-based interventions: fewer unnecessary activities, more targeted actions, higher likelihood of removing the root cause (not just the symptom).
OPERATIONAL METHOD: HOW TO BUILD EFFECTIVE PREDICTIVE MAINTENANCE
STEP 1 – CRITICAL ASSETS AND FAILURE MODES (LIGHT FMEA)
Start with the assets that generate the highest cost if they degrade: downtime, scrap, loss of quality, safety or compliance risks. Then define “how they fail” pragmatically (light FMEA): critical components, typical failure modes, process impact, observable signals and countermeasures.
A useful logic is: event à effect à measurable evidence. In power quality, evidence often lies in patterns (repetition, drift, instability), not just in instantaneous values.
STEP 2 – BASELINE + GRANULARITY
Baseline is the operational definition of “normal” (per site, line, shift, product). Without baseline, any threshold is arbitrary.
Granularity matters because many disturbances are fast: if you measure too slowly, you miss what actually causes micro-stops and resets. Baseline should include:
- representative time windows (days/weeks)
- different process conditions
- segmentation by line/machine/recipe where needed.
STEP 3 – DETECTION RULES (BEYOND THRESHOLDS)
Thresholds are only the first level. A mature detection approach combines:
- Static threshold: fixed limit (simple, often too rigid).
- Dynamic threshold (vs baseline): alert when you deviate from normal for that context.
- Trend: slow but steady increase/decrease (e.g., drift).
- Rate-of-change: speed of change (useful to detect rapid deterioration).
- Process correlations: the anomaly makes sense only when linked to a process event/recipe/line.
STEP 4 – WORKFLOW: FROM ALERT TO ACTION (AVOID ALARM FATIGUE)
To avoid alarm fatigue you need clear engagement rules:
- who receives what (maintenance, energy manager, production)
- severity and priority (info / warning / critical)
- response times and escalation criteria
- alert closure with a technical note
- root cause: each relevant event feeds an internal knowledge base (what happened, why, how to prevent it).
USEFUL KPIs AND DELIVERABLES (TECHNICAL + MANAGEMENT)
TECHNICAL KPIS
Power-quality KPIs that show whether you’re improving:
- number and type of events (per period, per line, per time band)
- stability: variability indicators (how much voltage/currents/power factor oscillate)
- trends and drift: progressive deviation from baseline
- repetition: frequency and recurrence of transients/minor alarms
- time in anomaly: not only how many events, but how long you stay in non-optimal conditions.
Typical technical deliverables:
- event report with classification and severity
- trend charts and comparisons vs baseline
- correlations with process events (where available)
- prioritised list of corrective/preventive actions.
OPERATIONAL/ECONOMIC KPIS (WITHOUT NUMBERS)
The goal isn’t “accounting”; it’s making value readable for decision-makers:
- faster diagnosis (less time to understand what’s happening)
- less downtime and greater continuity
- less scrap and more stable quality
- fewer “trial-and-error” interventions: from reactive maintenance to targeted actions
- longer asset life through reduced stress and continuous control.
WHY CLOUD DATA MAKES PREDICTIVE MAINTENANCE SCALABLE (MULTI-SITE, HISTORY, ALERTS, ANALYSIS)
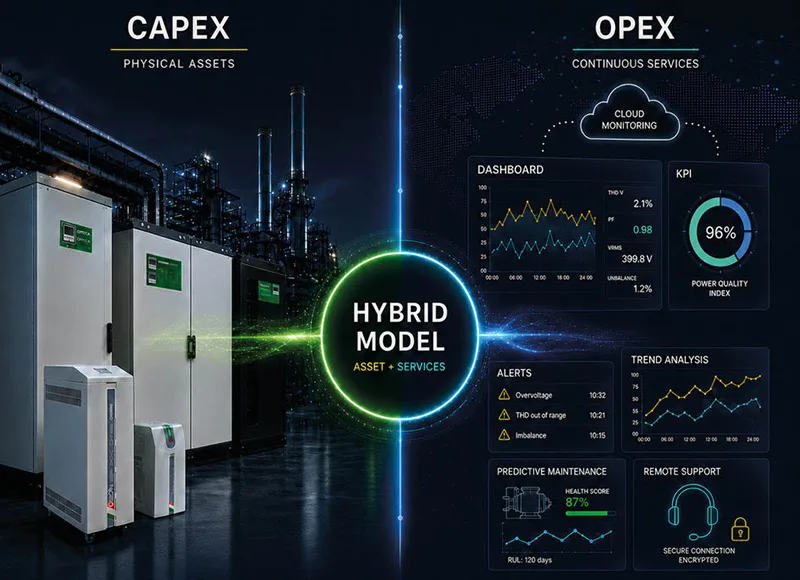
Ortea also includes remote monitoring services via the Ortea XCloud cloud platform to control electrical parameters, consumption and alarms in real time.
3 PRACTICAL REASONS
- Data continuity and history
Without history you see snapshots; with history you understand trends, cycles and drift.
- Push alerts
You don’t need to “go and look”: you get notified when it matters, with severity rules.
- Analysis, export and reporting
Data becomes reusable: reports for audits, post-event analysis, root cause support.
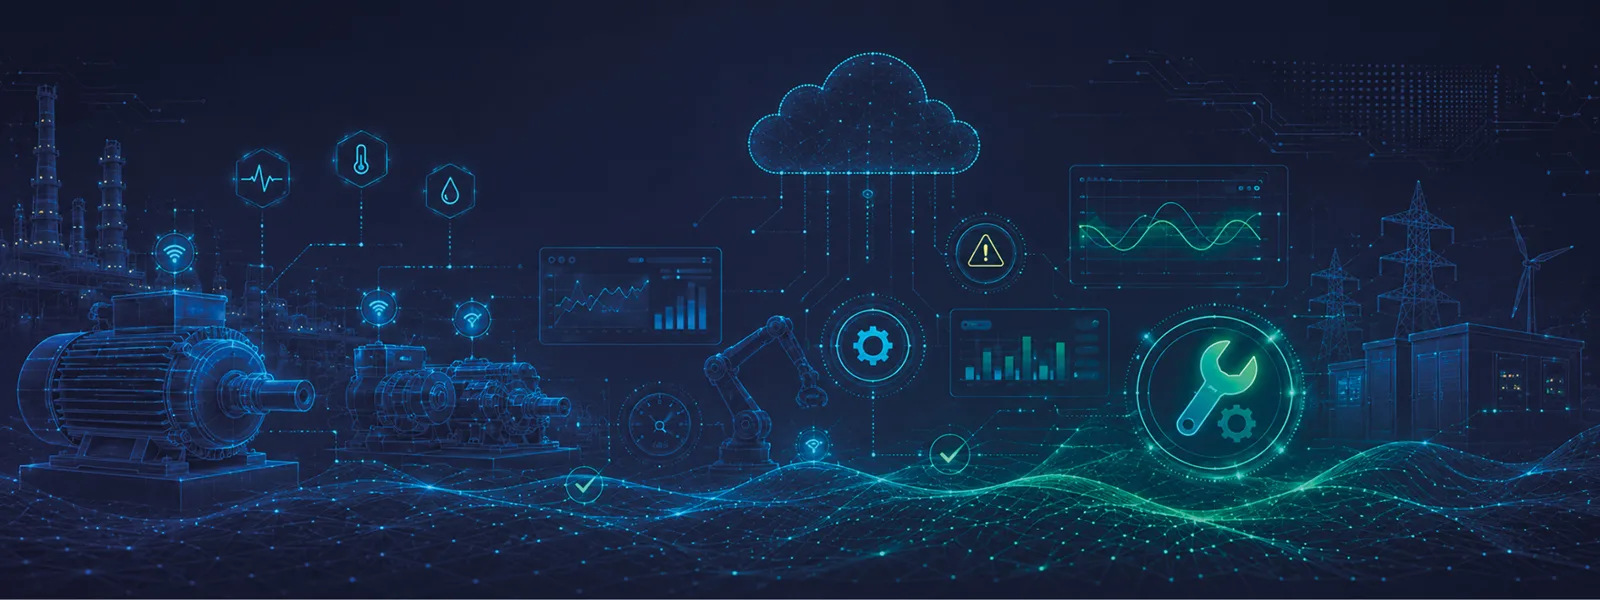
TYPICAL ARCHITECTURE (HIGH-LEVEL DESCRIPTION)
- Field sensors/instruments (electrical and, if present, physical measurements)
- Edge/gateway (collection, normalisation, first processing)
- Cloud platform (storage, rules, analytics)
- Dashboard + event history
- Notifications + workflow
- Export/api/reports
A PRACTICAL EXAMPLE: ORTEA XCLOUD APPLIED TO PREDICTIVE MAINTENANCE
Imagine a company with multiple production areas and a straightforward goal: reduce micro-stops and reactive interventions linked to network disturbances, voltage variations or non-optimal operating conditions. In such a context, Ortea XCloud becomes the single point of control for remote monitoring of equipment, centralising dashboards and event history.
The value, from a predictive standpoint, isn’t simply “seeing an alarm”: it’s correlating what the plant is doing with what the data is telling you. Continuous monitoring of electrical and physical parameters makes it possible to identify slow drift (a shifting baseline), repeated transients and instability that grows over time. In parallel, having active alerts, charts and history helps recognise patterns: for example, an anomaly that appears only during line start-up, or a progressive increase in variability towards the end of a shift.
Operationally, the ability to download data with filters (by variables and time range) speeds up post-event analysis and root cause investigation: instead of trial and error, the technical team can verify what changed before a stop or degradation. Completing the loop, email/SMS notifications on alarm activation/clearing help reduce response time, preventing a weak signal from remaining invisible until it becomes an issue.
The expected outcome is tangible: faster and more targeted interventions, with reduced service disruptions and indirect costs (downtime, scrap, breakdowns). In short, predictive maintenance stops being a concept and becomes a method: data → signals → action.
WHICH ORTEA SOLUTIONS CAN BENEFIT FROM PREDICTIVE MONITORING
In a predictive maintenance context, cloud value increases when equipment can be observed over time (trends, recurring events, alerts, operating conditions). Depending on the plant configuration and objectives (continuity, voltage quality, efficiency), this may include solutions such as:
- Voltage stabilisers (Sirius / Sirius Advance): useful to detect drift, instability and stress conditions that precede critical issues.
- Energy efficiency/energy saving systems (Enersolve / Powersines): continuous monitoring to detect deviations versus baseline and recurring anomalies.
- Voltage dip and micro-interruption compensators (Oxygen / Oxygen Zero): event and recurrence tracking to understand when and why disturbances occur.
- Power factor correction systems (MULTImatic): monitoring of power factor, currents and trends to identify drift and degradation signals.
THE ROLE OF THE EDGE (NEB) IN 2 LINES
The edge (NEB – Next cloud Edge Box) acts as a bidirectional bridge between field equipment and the cloud platform: it collects data, enables signalling and supports operational functions such as remote updates and management, bringing intelligence closer to the machine.